New Mexico Department of Workforce Solutions
Economic Research and Analysis Bureau
Occupational Employment Statistics (OES)
Albuquerque, NM MSA
Farmington, NM MSA
Las Cruces, NM MSA
Santa Fe, NM MSA
00-0000 --TOTAL ALL OCCUPATIONS
11-0000 --MANAGEMENT OCCUPATIONS
11-1021 General and Operations Managers
11-2022 Sales Managers
11-3011 Administrative Services Managers
11-3021 Computer and Information Systems Managers
11-3031 Financial Managers
11-3121 Human Resources Managers
11-9021 Construction Managers
11-9031 Education Administrators, Preschool and Child Care Center/Program
11-9032 Education Administrators, Elementary and Secondary School
11-9033 Education Administrators, Postsecondary
11-9051 Food Service Managers
11-9081 Lodging Managers
11-9111 Medical and Health Services Managers
11-9121 Natural Sciences Managers
11-9141 Property, Real Estate, and Community Association Managers
11-9151 Social and Community Service Managers
11-9199 Managers, All Other
13-0000 --BUSINESS AND FINANCIAL OPERATIONS OCCUPATIONS
13-1022 Wholesale and Retail Buyers, Except Farm Products
13-1023 Purchasing Agents, Except Wholesale, Retail, and Farm Products
13-1041 Compliance Officers, Except Agriculture, Construction, Health and Safety, and Transport...
13-1051 Cost Estimators
13-1071 Employment, Recruitment, and Placement Specialists
13-1111 Management Analysts
13-1121 Meeting, Convention, and Event Planners
13-1131 Fundraisers
13-1141 Compensation, Benefits, and Job Analysis Specialists
13-1151 Training and Development Specialists
13-1161 Market Research Analysts
13-1199 Business Operations Specialists, All Other
13-2011 Accountants and Auditors
13-2021 Appraisers and Assessors of Real Estate
13-2051 Financial Analysts
13-2052 Personal Financial Advisors
13-2072 Loan Officers
13-2081 Tax Examiners, Collectors, and Revenue Agents
13-2099 Financial Specialists, All Other
15-0000 --COMPUTER AND MATHEMATICAL OCCUPATIONS
15-1121 Computer Systems Analysts
15-1131 Computer Programmers
15-1132 Computer Software Engineers, Applications
15-1133 Computer Software Engineers, Systems Software
15-1134 Web Developers
15-1141 Database Administrators
15-1142 Network and Computer Systems Administrators
15-1151 Computer Support Specialists
15-1152 Computer Network Support Specialists
15-1199 Computer Occupations, All Other
17-0000 --ARCHITECTURE AND ENGINEERING OCCUPATIONS
17-1011 Architects, Except Landscape and Naval
17-1022 Surveyors
17-2051 Civil Engineers
17-2071 Electrical Engineers
17-2199 Engineers, All Other
17-3011 Architectural and Civil Drafters
17-3022 Civil Engineering Technicians
17-3031 Surveying and Mapping Technicians
19-0000 --LIFE, PHYSICAL, AND SOCIAL SCIENCE OCCUPATIONS
19-1023 Zoologists and Wildlife Biologists
19-2041 Environmental Scientists and Specialists, Including Health
19-2042 Geoscientists, Except Hydrologists and Geographers
19-3051 Urban and Regional Planners
19-3091 Anthropologists and Archeologists
19-4093 Forest and Conservation Technicians
21-0000 --COMMUNITY AND SOCIAL SERVICES OCCUPATIONS
21-1011 Substance Abuse and Behavioral Disorder Counselors
21-1012 Educational, Vocational, and School Counselors
21-1014 Mental Health Counselors
21-1015 Rehabilitation Counselors
21-1021 Child, Family, and School Social Workers
21-1022 Medical and Public Health Social Workers
21-1023 Mental Health and Substance Abuse Social Workers
21-1029 Social Workers, All Other
21-1091 Health Educators
21-1092 Probation Officers and Correctional Treatment Specialists
21-1093 Social and Human Service Assistants
21-1099 Community and Social Service Specialists, All Other
23-0000 --LEGAL OCCUPATIONS
23-1011 Lawyers
23-2011 Paralegals and Legal Assistants
23-2093 Title Examiners, Abstractors, and Searchers
25-0000 --EDUCATION, TRAINING, AND LIBRARY OCCUPATIONS
25-1121 Art, Drama, and Music Teachers, Postsecondary
25-1199 Postsecondary Teachers, All Other
25-2011 Preschool Teachers, Except Special Education
25-2012 Kindergarten Teachers, Except Special Education
25-2021 Elementary School Teachers, Except Special Education
25-2031 Secondary School Teachers, Except Special and Vocational Education
25-2052 Special Education Teachers, Kindergarten, and Elementary School
25-2053 Special Education Teachers, Middle School
25-2054 Special Education Teachers, Secondary School
25-2059 Special Education Teachers, All Other
25-3021 Self-Enrichment Education Teachers
25-3098 Substitute teachers
25-3099 Teachers and Instructors, All Other
25-4012 Curators
25-4013 Museum Technicians and Conservators
25-4021 Librarians
25-4031 Library Technicians
25-9031 Instructional Coordinators
25-9041 Teacher Assistants
27-0000 --ARTS, DESIGN, ENTERTAINMENT, SPORTS, AND MEDIA OCCUPATIONS
27-1013 Fine Artists, Including Painters, Sculptors, and Illustrators
27-1024 Graphic Designers
27-1025 Interior Designers
27-2012 Producers and Directors
27-3031 Public Relations Specialists
27-3041 Editors
27-4011 Audio and Video Equipment Technicians
27-4021 Photographers
29-0000 --HEALTHCARE PRACTITIONERS AND TECHNICAL OCCUPATIONS
29-1021 Dentists, General
29-1051 Pharmacists
29-1062 Family and General Practitioners
29-1069 Physicians and Surgeons, All Other
29-1071 Physician Assistants
29-1122 Occupational Therapists
29-1123 Physical Therapists
29-1126 Respiratory Therapists
29-1127 Speech-Language Pathologists
29-1131 Veterinarians
29-1141 Registered Nurses
29-1171 Nurse Practitioners
29-2011 Medical and Clinical Laboratory Technologists
29-2012 Medical and Clinical Laboratory Technicians
29-2021 Dental Hygienists
29-2041 Emergency Medical Technicians and Paramedics
29-2052 Pharmacy Technicians
29-2056 Veterinary Technologists and Technicians
29-2061 Licensed Practical and Licensed Vocational Nurses
29-2071 Medical Records and Health Information Technicians
29-9099 Healthcare Practitioners and Technical Workers, All Other
31-0000 --HEALTHCARE SUPPORT OCCUPATIONS
31-1014 Nursing Assistants
31-2021 Physical Therapist Assistants
31-9091 Dental Assistants
31-9092 Medical Assistants
31-9095 Pharmacy Aides
31-9096 Veterinary Assistants and Laboratory Animal Caretakers
31-9097 Phlebotomists
31-9099 Healthcare Support Workers, All Other
33-0000 --PROTECTIVE SERVICE OCCUPATIONS
33-1021 First-Line Supervisors/Managers of Fire Fighting and Prevention Workers
33-1099 First-Line Supervisors/Managers, Protective Service Workers, All Other
33-3021 Detectives and Criminal Investigators
33-3051 Police and Sheriff's Patrol Officers
33-9032 Security Guards
33-9092 Lifeguards, Ski Patrol, and Other Recreational Protective Service Workers
33-9099 Protective Service Workers, All Other
35-0000 --FOOD PREPARATION AND SERVING-RELATED OCCUPATIONS
35-1011 Chefs and Head Cooks
35-1012 First-Line Supervisors/Managers of Food Preparation and Serving Workers
35-2011 Cooks, Fast Food
35-2012 Cooks, Institution and Cafeteria
35-2014 Cooks, Restaurant
35-2015 Cooks, Short Order
35-2021 Food Preparation Workers
35-3011 Bartenders
35-3021 Combined Food Preparation and Serving Workers, Including Fast Food
35-3022 Counter Attendants, Cafeteria, Food Concession, and Coffee Shop
35-3031 Waiters and Waitresses
35-3041 Food Servers, Nonrestaurant
35-9011 Dining Room and Cafeteria Attendants and Bartender Helpers
35-9021 Dishwashers
35-9031 Hosts and Hostesses, Restaurant, Lounge, and Coffee Shop
37-0000 --BUILDING AND GROUNDS CLEANING AND MAINTENANCE OCCUPATIONS
37-1011 First-Line Supervisors/Managers of Housekeeping and Janitorial Workers
37-1012 First-Line Supervisors/Managers of Landscaping, Lawn Service, and Groundskeeping Workers
37-2011 Janitors and Cleaners, Except Maids and Housekeeping Cleaners
37-2012 Maids and Housekeeping Cleaners
37-3011 Landscaping and Groundskeeping Workers
39-0000 --PERSONAL CARE AND SERVICE OCCUPATIONS
39-1021 First-Line Supervisors/Managers of Personal Service Workers
39-2021 Nonfarm Animal Caretakers
39-5012 Hairdressers, Hairstylists, and Cosmetologists
39-6011 Baggage Porters and Bellhops
39-6012 Concierges
39-7011 Tour Guides and Escorts
39-9011 Child Care Workers
39-9021 Personal and Home Care Aides
39-9032 Recreation Workers
41-0000 --SALES AND RELATED OCCUPATIONS
41-1011 First-Line Supervisors/Managers of Retail Sales Workers
41-1012 First-Line Supervisors/Managers of Non-Retail Sales Workers
41-2011 Cashiers
41-2021 Counter and Rental Clerks
41-2022 Parts Salespersons
41-2031 Retail Salespersons
41-3021 Insurance Sales Agents
41-3031 Securities, Commodities, and Financial Services Sales Agents
41-3099 Sales Representatives, Services, All Other
41-4011 Sales Representatives, Wholesale and Manufacturing, Technical and Scientific Products
41-4012 Sales Representatives, Wholesale and Manufacturing, Except Technical and Scientific Pro...
41-9022 Real Estate Sales Agents
41-9041 Telemarketers
41-9099 Sales and Related Workers, All Other
43-0000 --OFFICE AND ADMINISTRATIVE SUPPORT OCCUPATIONS
43-1011 First-Line Supervisors/Managers of Office and Administrative Support Workers
43-2011 Switchboard Operators, Including Answering Service
43-3011 Bill and Account Collectors
43-3021 Billing and Posting Clerks and Machine Operators
43-3031 Bookkeeping, Accounting, and Auditing Clerks
43-3051 Payroll and Timekeeping Clerks
43-3061 Procurement Clerks
43-3071 Tellers
43-4031 Court, Municipal, and License Clerks
43-4051 Customer Service Representatives
43-4061 Eligibility Interviewers, Government Programs
43-4071 File Clerks
43-4081 Hotel, Motel, and Resort Desk Clerks
43-4111 Interviewers, Except Eligibility and Loan
43-4131 Loan Interviewers and Clerks
43-4141 New Accounts Clerks
43-4161 Human Resources Assistants, Except Payroll and Timekeeping
43-4171 Receptionists and Information Clerks
43-4199 Information and Record Clerks, All Other
43-5021 Couriers and Messengers
43-5031 Police, Fire, and Ambulance Dispatchers
43-5032 Dispatchers, Except Police, Fire, and Ambulance
43-5071 Shipping, Receiving, and Traffic Clerks
43-5081 Stock Clerks and Order Fillers
43-6011 Executive Secretaries and Administrative Assistants
43-6012 Legal Secretaries
43-6013 Medical Secretaries
43-6014 Secretaries, Except Legal, Medical, and Executive
43-9021 Data Entry Keyers
43-9041 Insurance Claims and Policy Processing Clerks
43-9051 Mail Clerks and Mail Machine Operators, Except Postal Service
43-9061 Office Clerks, General
43-9071 Office Machine Operators, Except Computer
43-9199 Office and Administrative Support Workers, All Other
45-0000 --FARMING, FISHING, AND FORESTRY OCCUPATIONS
47-0000 --CONSTRUCTION AND EXTRACTION OCCUPATIONS
47-1011 First-Line Supervisors/Managers of Construction Trades and Extraction Workers
47-2021 Brickmasons and Blockmasons
47-2031 Carpenters
47-2051 Cement Masons and Concrete Finishers
47-2061 Construction Laborers
47-2073 Operating Engineers and Other Construction Equipment Operators
47-2081 Drywall and Ceiling Tile Installers
47-2141 Painters, Construction and Maintenance
47-2152 Plumbers, Pipefitters, and Steamfitters
47-2161 Plasterers and Stucco Masons
47-2181 Roofers
47-2211 Sheet Metal Workers
47-3015 Helpers--Pipelayers, Plumbers, Pipefitters, and Steamfitters
47-4011 Construction and Building Inspectors
47-4051 Highway Maintenance Workers
49-0000 --INSTALLATION, MAINTENANCE, AND REPAIR OCCUPATIONS
49-1011 First-Line Supervisors/Managers of Mechanics, Installers, and Repairers
49-3021 Automotive Body and Related Repairers
49-3023 Automotive Service Technicians and Mechanics
49-3031 Bus and Truck Mechanics and Diesel Engine Specialists
49-3093 Tire Repairers and Changers
49-9071 Maintenance and Repair Workers, General
49-9091 Coin, Vending, and Amusement Machine Servicers and Repairers
49-9098 Helpers--Installation, Maintenance, and Repair Workers
51-0000 --PRODUCTION OCCUPATIONS
51-1011 First-Line Supervisors/Managers of Production and Operating Workers
51-2092 Team Assemblers
51-2099 Assemblers and Fabricators, All Other
51-3011 Bakers
51-3021 Butchers and Meat Cutters
51-4041 Machinists
51-4121 Welders, Cutters, Solderers, and Brazers
51-5112 Printing Press Operators
51-6011 Laundry and Dry-Cleaning Workers
51-8031 Water and Liquid Waste Treatment Plant and System Operators
51-9071 Jewelers and Precious Stone and Metal Workers
51-9199 Production Workers, All Other
53-0000 --TRANSPORTATION AND MATERIAL MOVING OCCUPATIONS
53-1021 First-Line Supervisors/Managers of Helpers, Laborers, and Material Movers, Hand
53-1031 First-Line Supervisors/Managers of Transportation and Material-Moving Machine and Vehic...
53-3021 Bus Drivers, Transit and Intercity
53-3031 Driver/Sales Workers
53-3032 Truck Drivers, Heavy and Tractor-Trailer
53-3033 Truck Drivers, Light or Delivery Services
53-6031 Service Station Attendants
53-7051 Industrial Truck and Tractor Operators
53-7061 Cleaners of Vehicles and Equipment
53-7062 Laborers and Freight, Stock, and Material Movers, Hand
53-7064 Packers and Packagers, Hand
Santa Fe, NM MSA
All-industry
Mean wage
18.37
Mean RSE
2.80
Entry wage
11.65
Experienced wage
21.74
25th percentile wage
12.82
50th percentile wage
16.60
75th percentile wage
22.70
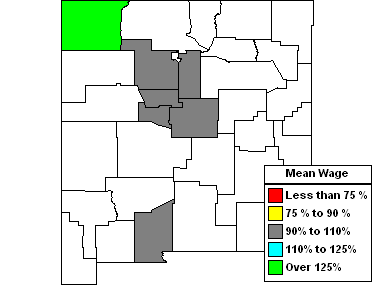
Installation, Maintenance, and Repair Occupations (49-0000)
Mean Wage History
This Occupation
Compared to Occupational Group
Difference
Current
$18.37
$18.37
$0.00
2012
$18.25
+.7%
$18.25
+.7%
$0.00
2011
$17.98
+1.5%
$17.98
+1.5%
$0.00
2010
$17.59
+2.2%
$17.59
+2.2%
$0.00
2009
$17.39
+1.2%
$17.39
+1.2%
$0.00
2008
$17.09
+1.7%
$17.09
+1.7%
$0.00
2007
$16.59
+3.0%
$16.59
+3.0%
$0.00
2006
$16.10
+3.0%
$16.10
+3.0%
$0.00
2005
$15.63
+3.0%
$15.63
+3.0%
$0.00
2004
$15.23
+2.7%
$15.23
+2.7%
$0.00
This Occupation
Compared to All Occupations
Difference
Current
$18.37
$20.65
-$2.27
2012
$18.25
+.7%
$20.52
+.6%
-$2.27
2011
$17.98
+1.5%
$20.17
+1.7%
-$2.19
2010
$17.59
+2.2%
$19.85
+1.6%
-$2.26
2009
$17.39
+1.2%
$19.52
+1.7%
-$2.13
2008
$17.09
+1.7%
$19.26
+1.4%
-$2.16
2007
$16.59
+3.0%
$18.76
+2.6%
-$2.17
2006
$16.10
+3.0%
$18.16
+3.3%
-$2.06
2005
$15.63
+3.0%
$17.60
+3.2%
-$1.96
2004
$15.23
+2.7%
$17.18
+2.5%
-$1.95
Top Areas For This Occupation
Best Pay
Mean Wage
Employment
Farmington, NM MSA
24.57
Albuquerque, NM MSA
20.00
Santa Fe, NM MSA
18.37
Las Cruces, NM MSA
18.19
Note: 201202 Microdata
Publication Date: May 2013